2.21 Straight Line Table of Values GCSE PowerPoint Lesson
£2.00
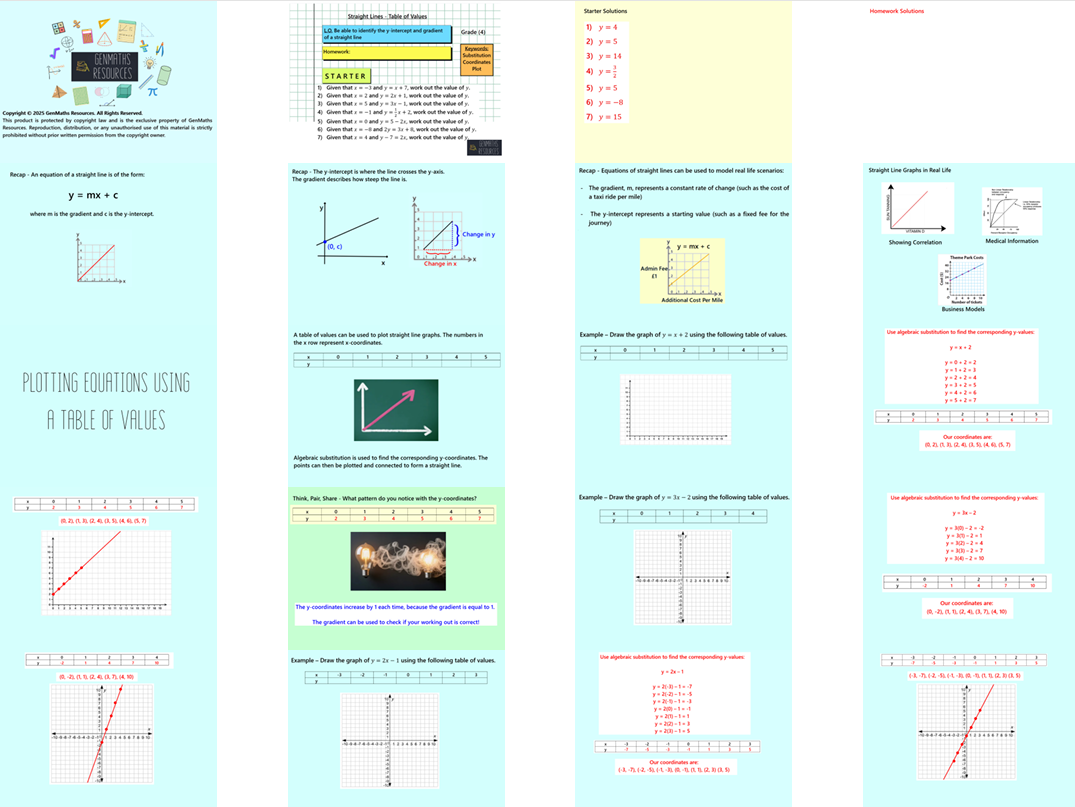
In this 32-slide lesson, students will learn how to complete a table of values to plot and draw the graph of a straight-line equation. They will substitute values of x into an equation to find the corresponding y-values and use these coordinate pairs to sketch the graph accurately. This foundational skill helps pupils understand the relationship between algebraic equations and their graphical representations. The lesson reinforces substitution, pattern recognition, and plotting points on a Cartesian grid.
The lesson includes:
Clear, guided examples
Discussion opportunities from Think, Pair, Share
One structured task to practise key skills
Challenge activity to extend and deepen learning
Perfect for engaging learners while reinforcing essential algebra concepts.