2.24 Distance Time Graphs GCSE PowerPoint Lesson
£2.00
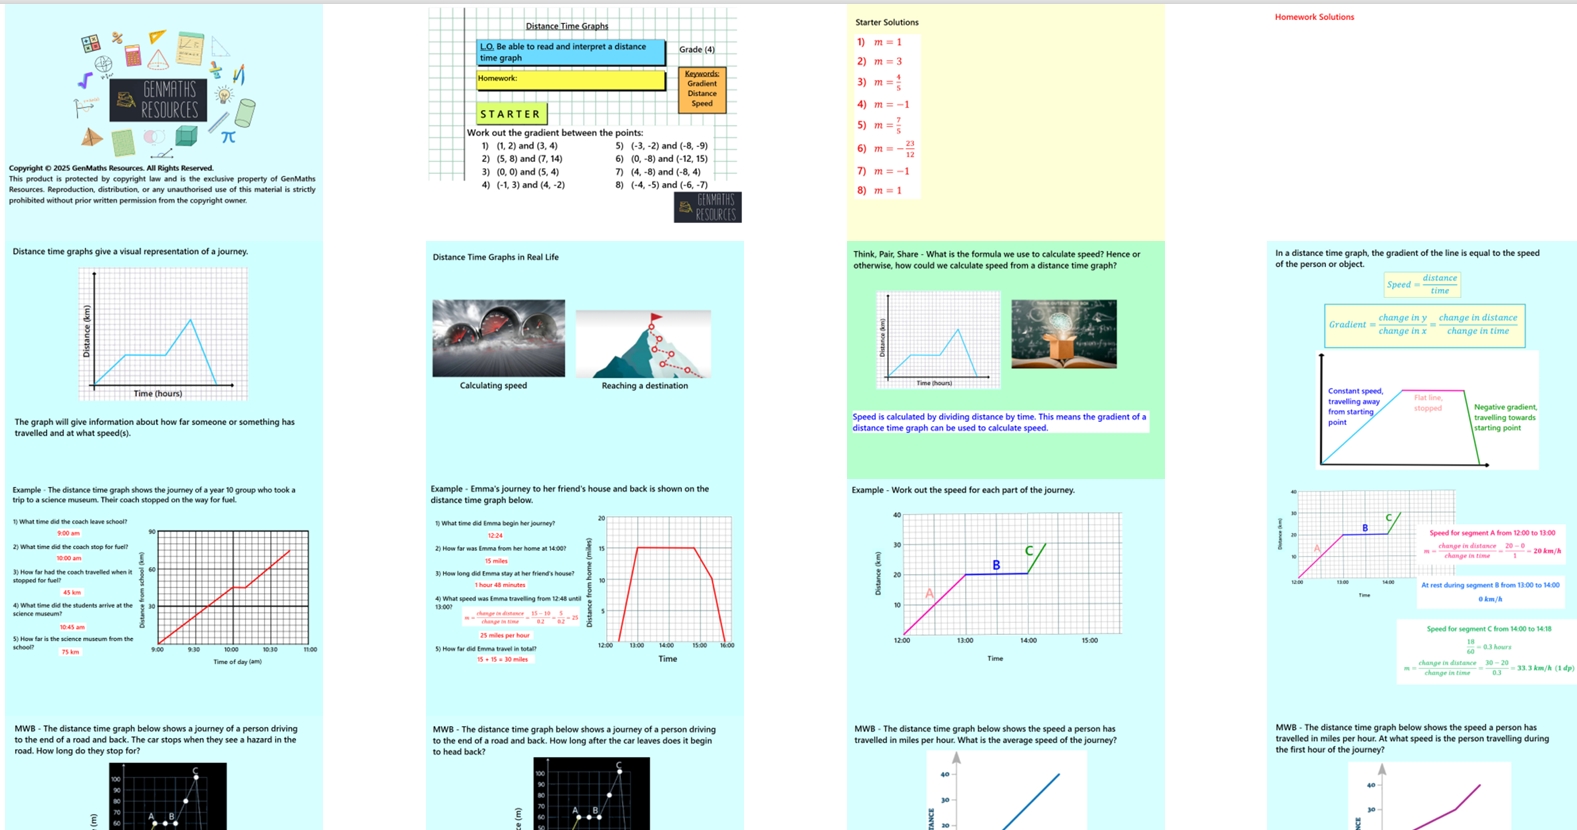
In this 21-slide lesson, students will learn how to interpret and draw distance-time graphs to represent real-life journeys. They will explore how the gradient of a line relates to speed and how to describe different sections of a graph, such as constant speed, rest, or changes in speed. The lesson develops students’ ability to link graphical features to motion and solve problems using the graph. This builds a deeper understanding of rates and relationships between variables.
Printable examples and worksheets at the end of PowerPoint that coincide with the lesson slides.
The lesson includes:
Clear, guided examples
Discussion opportunities from Think, Pair, Share
Mini whiteboard section to check understanding and clarify misconceptions
One structured task to practise key skills
Challenge activity to extend and deepen learning
Perfect for engaging learners while reinforcing essential algebra concepts.