2.25 Quadratic Graphs GCSE PowerPoint Lesson
£2.00
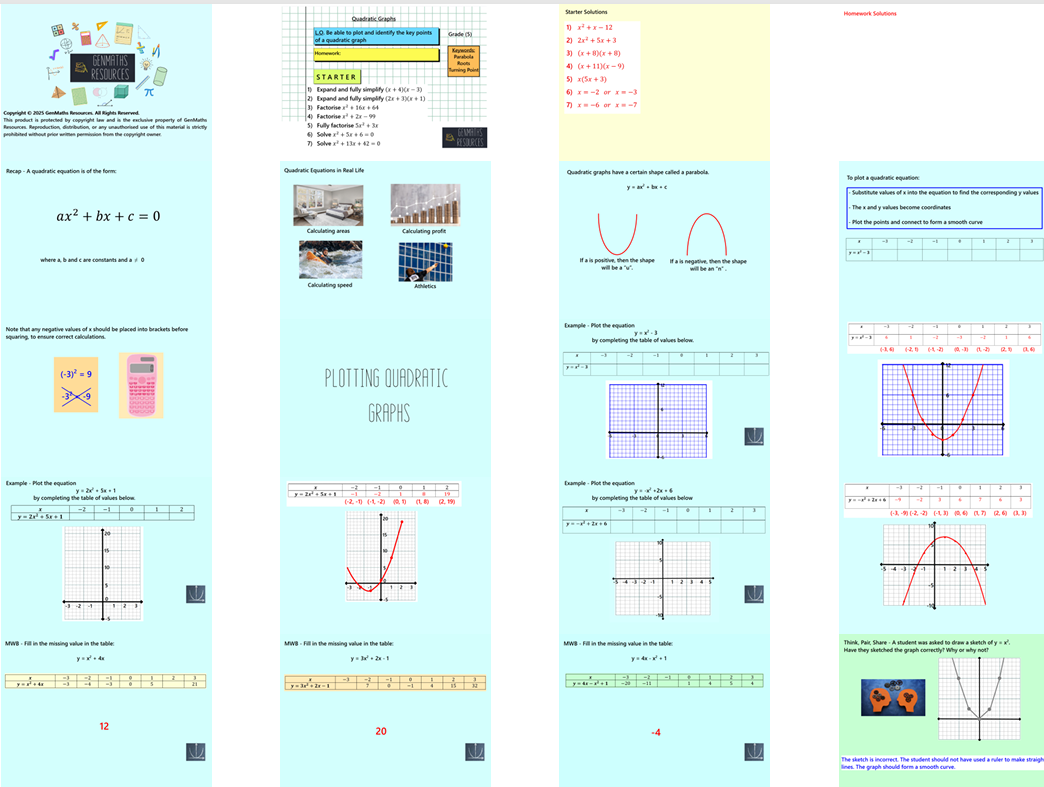
In this 35-slide lesson, students will learn how to plot quadratic graphs by completing a table of values and accurately drawing the curve. They will identify key features of the graph, including the roots (where the graph crosses the x-axis), the turning point, the y-intercept, and the line of symmetry. The lesson builds students’ understanding of the shape and behaviour of quadratic functions and how these features relate to the equation.
The lesson includes:
Clear, guided examples
Discussion opportunities from Think, Pair, Share
Mini whiteboard section to check understanding and clarify misconceptions
Two structured tasks to practise key skills
Challenge activity to extend and deepen learning
Perfect for engaging learners while reinforcing essential algebra concepts.