2.49 Velocity Time Graphs Higher GCSE PowerPoint Lesson
£2.00
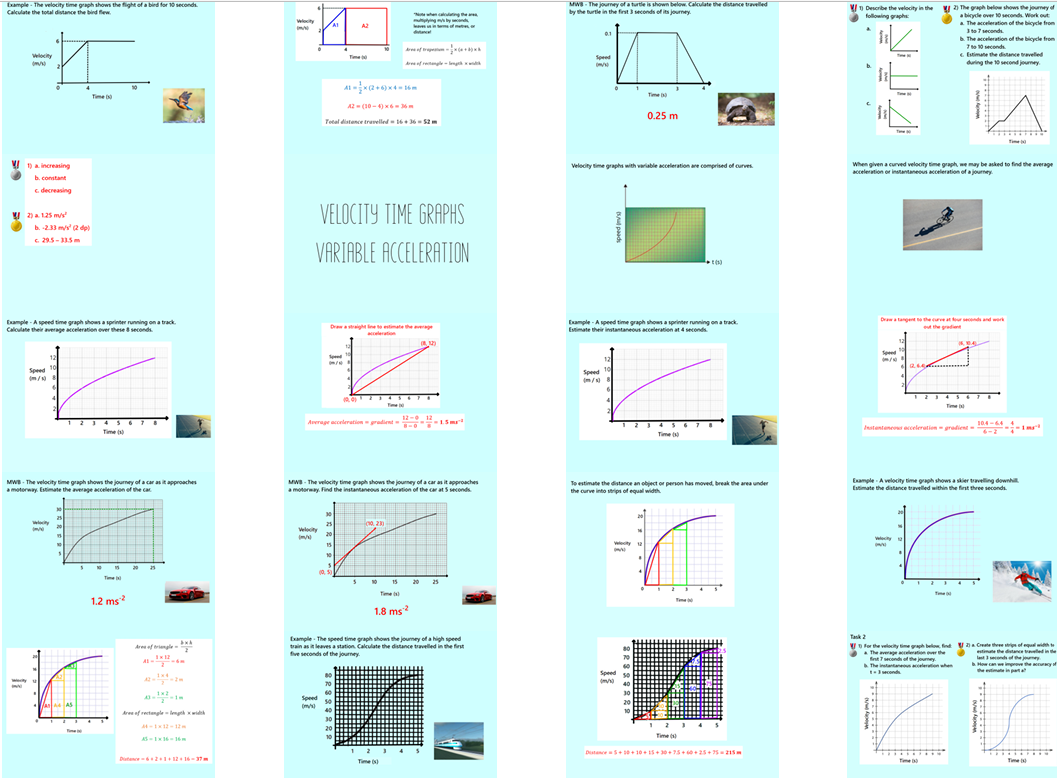
In this 43-slide lesson, students will explore velocity-time graphs, including those with both straight-line segments and curved sections. They will learn how to interpret the gradient of a velocity-time graph to determine acceleration and how to use the area under the graph to calculate the total distance travelled.
This content is on the Higher tier only.
The lesson includes:
Clear, guided examples
Discussion opportunities from Think, Pair, Share
Mini whiteboard section to check understanding and clarify misconceptions
Two structured tasks to practise key skills
Challenge activity to extend and deepen learning
Perfect for engaging learners while reinforcing essential algebra concepts