2.50 Inequality Regions Higher GCSE PowerPoint Lesson
£2.00
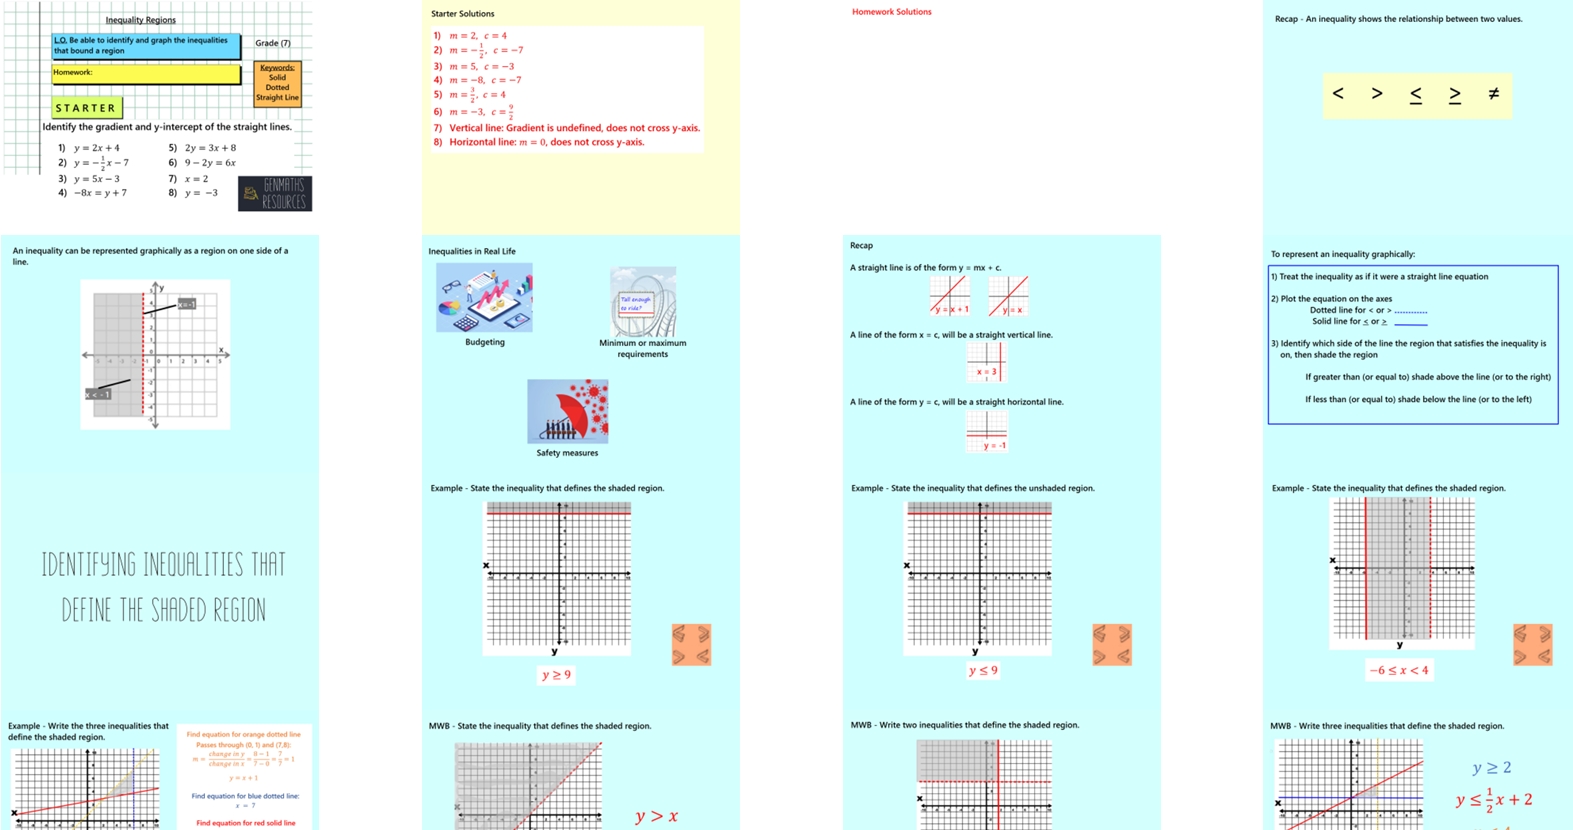
In this 36-slide lesson, students will learn how to represent linear inequalities on a coordinate grid. They will practise shading regions that satisfy one or more inequalities and interpreting dashed and solid boundary lines. Students will also explore how to describe a given region using a set of inequalities.
Slide 30 is a printable sheet, that goes with the graphing task.
This content is on the Higher tier only.
The lesson includes:
Clear, guided examples
Discussion opportunities from Think, Pair, Share
Mini whiteboard section to check understanding and clarify misconceptions
Two structured tasks to practise key skills
Challenge activity to extend and deepen learning
Perfect for engaging learners while reinforcing essential algebra concepts.