3.46 Trigonometric Graphs GCSE Higher PowerPoint Lesson
£2.00
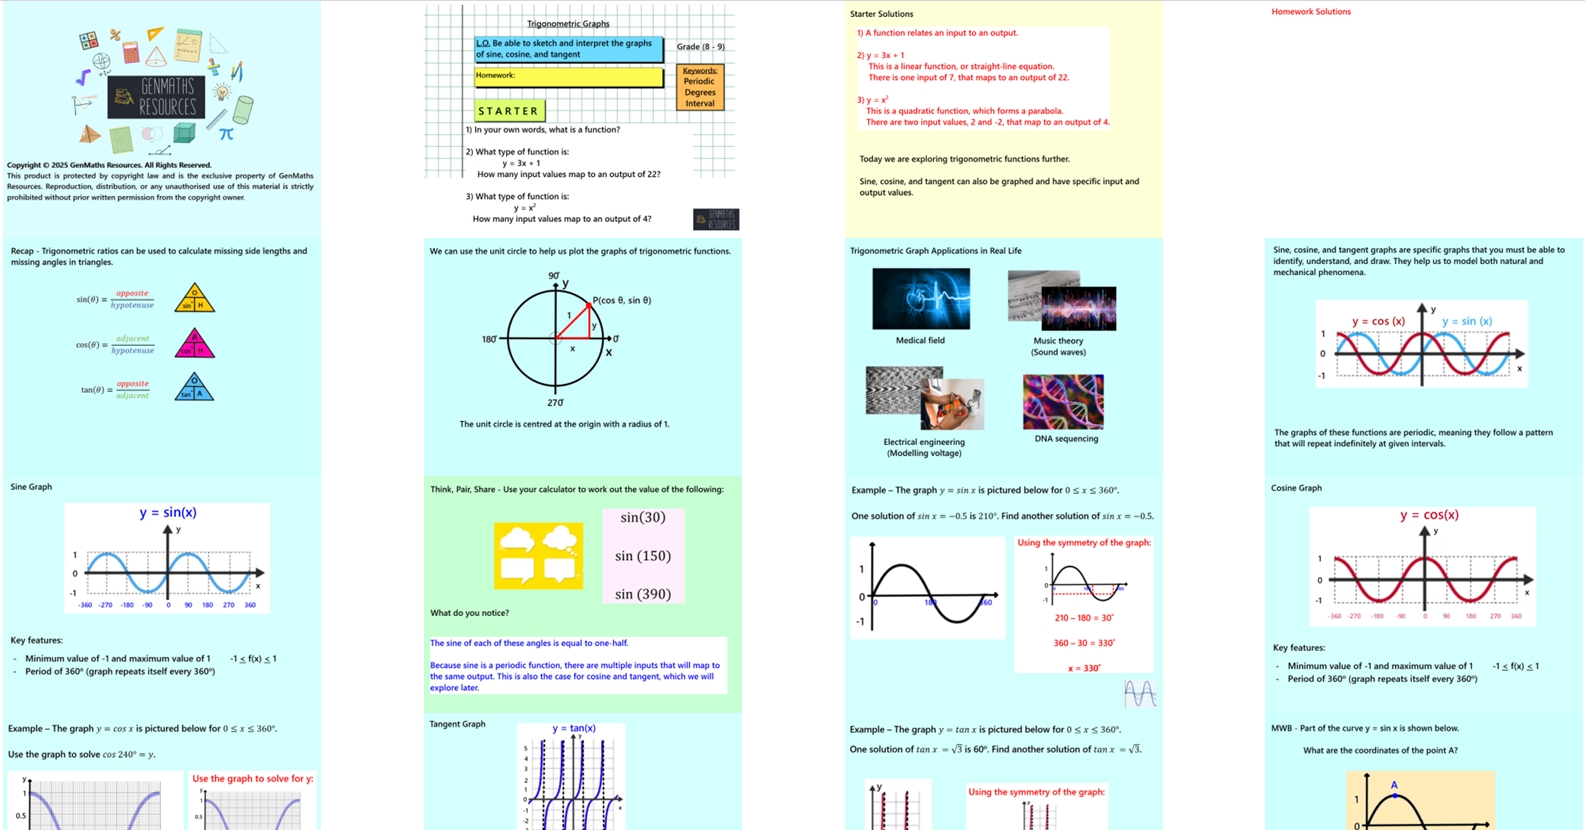
In this 26-slide lesson, pupils will learn how to draw and interpret the graphs of the sine, cosine, and tangent functions over a range of angles (0° to 360°). They will explore key features such as period and symmetry, and understand how these graphs relate to values on the unit circle. Pupils will also learn to identify and plot key points for each function, use trigonometric graphs to solve equations graphically, and estimate angles from graphs and interpret their meaning in context. This lesson builds fluency in sketching and interpreting trigonometric graphs and prepares pupils for solving trigonometric equations and modelling periodic phenomena.
Note this lesson is for the higher tier.
The lesson includes:
Clear, guided examples
Discussion opportunities from Think, Pair, Share
Mini whiteboard section to check understanding and clarify misconceptions
Two structured tasks to practise key skills
Challenge activity to extend and deepen learning
Perfect for engaging learners while reinforcing essential geometry concepts.