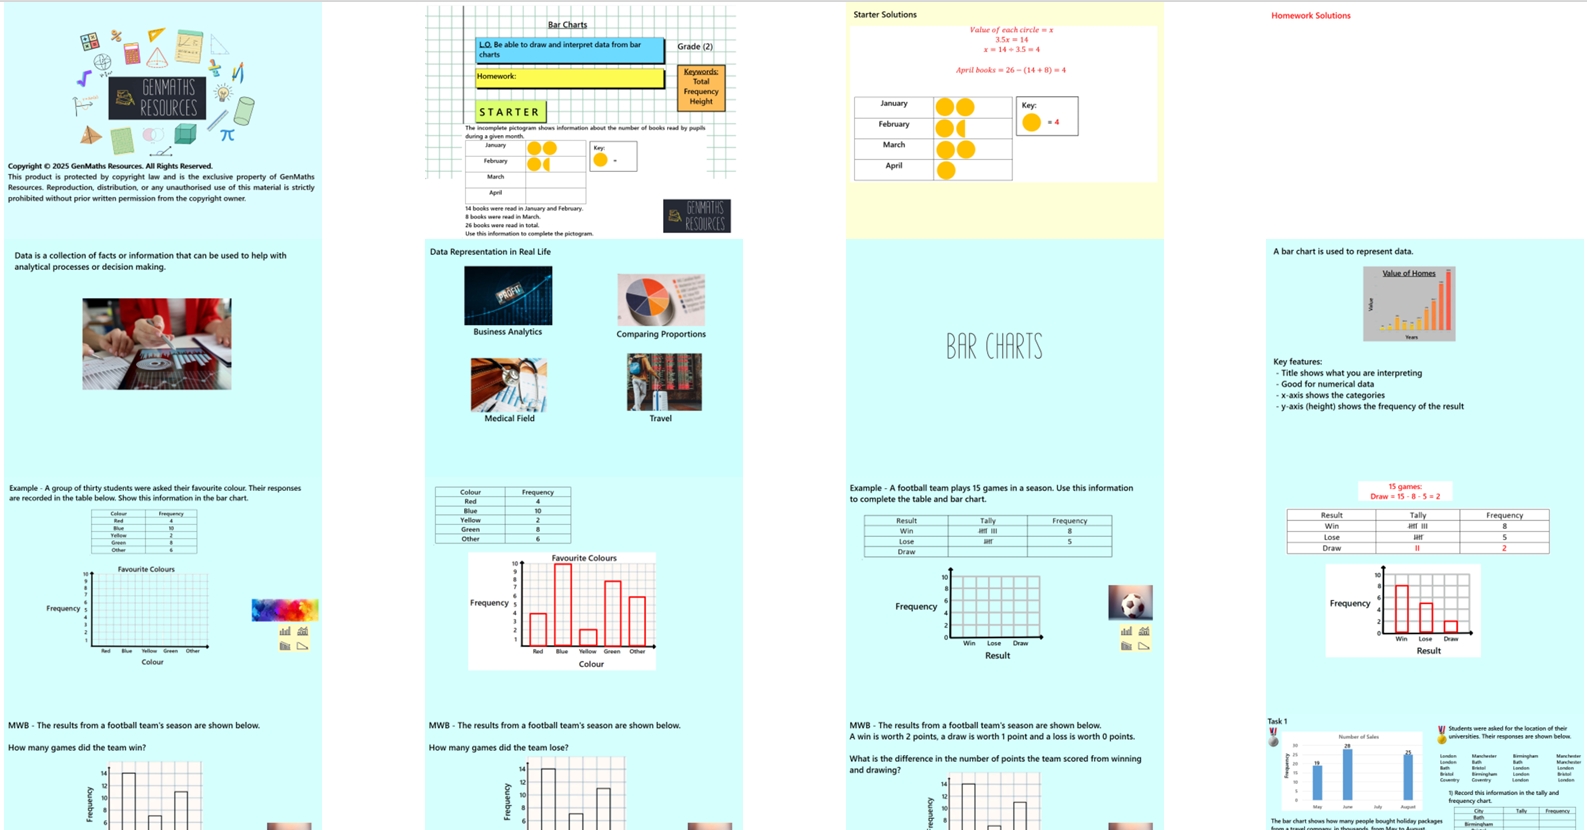
4.10 Bar Charts GCSE PowerPoint Lesson
£2.00
In this 25-slide lesson, pupils will learn how to construct and interpret both single and dual bar charts. They will understand how to compare different data sets by reading and creating bar charts with clearly labelled axes and scales. Dual bar charts will be used to highlight comparisons between groups or categories.
The lesson includes:
Clear, guided examples
Discussion opportunities from Think, Pair, Share
Mini whiteboard section to check understanding and clarify misconceptions
Two structured tasks to practise key skills
Challenge activity to extend and deepen learning
Perfect for engaging learners while reinforcing essential data and statistics concepts.