4.11 Pie Charts GCSE PowerPoint Lesson
£2.00
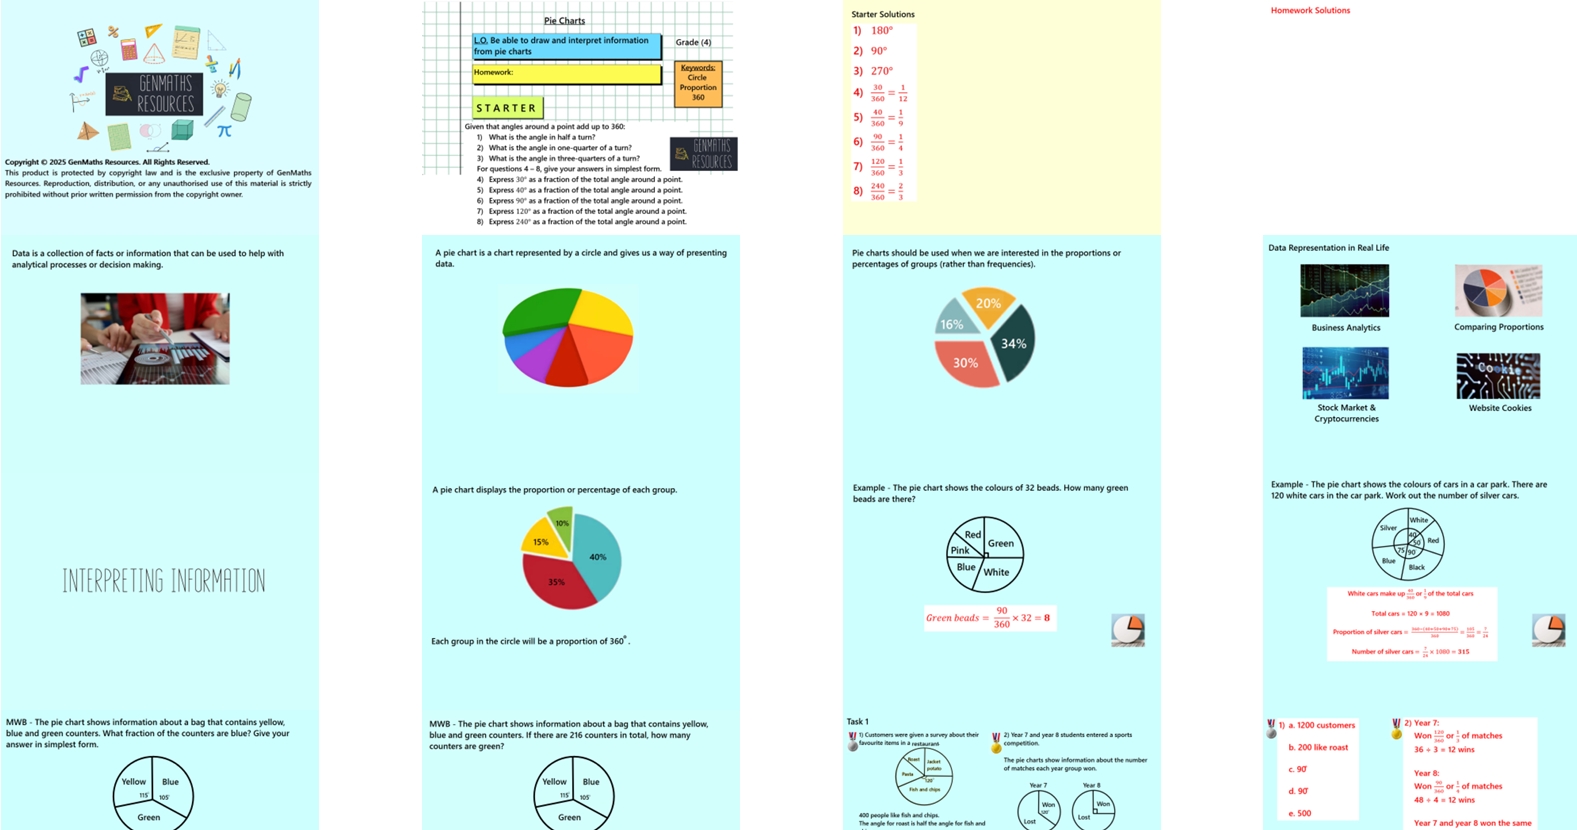
In this 26-slide lesson, pupils will learn how to interpret and draw pie charts by calculating angles to represent proportions of a whole. They will practise converting between fractions, percentages, and angles to construct accurate charts. Pupils will also explore real-life contexts to deepen their understanding of data distribution.
The lesson includes:
Clear, guided examples
Discussion opportunities from Think, Pair, Share
Mini whiteboard section to check understanding and clarify misconceptions
Two structured tasks to practise key skills
Challenge activity to extend and deepen learning
Perfect for engaging learners while reinforcing essential data and statistics concepts.