4.13 Stem and Leaf Diagrams GCSE PowerPoint Lesson
£2.00
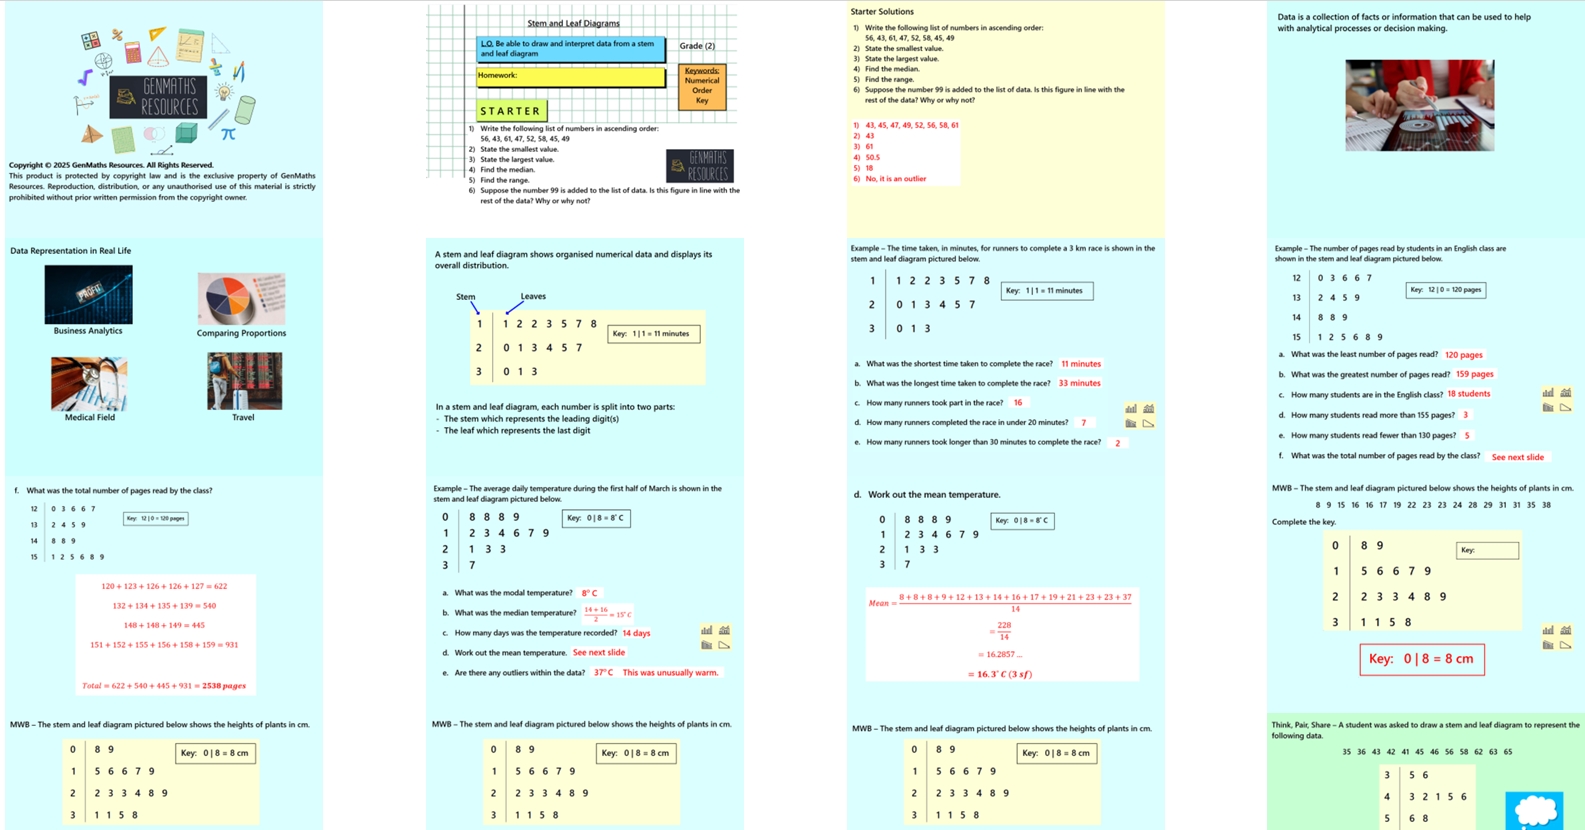
In this 27-slide lesson, pupils will learn how to display numerical data using stem and leaf diagrams, including ordered and back-to-back formats. They will extract key information such as the mode, median, and range directly from the diagram. This topic reinforces place value understanding and the organisation of data.
The lesson includes:
Clear, guided examples
Discussion opportunities from Think, Pair, Share
Mini whiteboard section to check understanding and clarify misconceptions
Two structured tasks to practise key skills
Challenge activity to extend and deepen learning
Perfect for engaging learners while reinforcing essential data and statistics concepts.