4.15 Venn Diagrams GCSE PowerPoint Lesson
£2.00
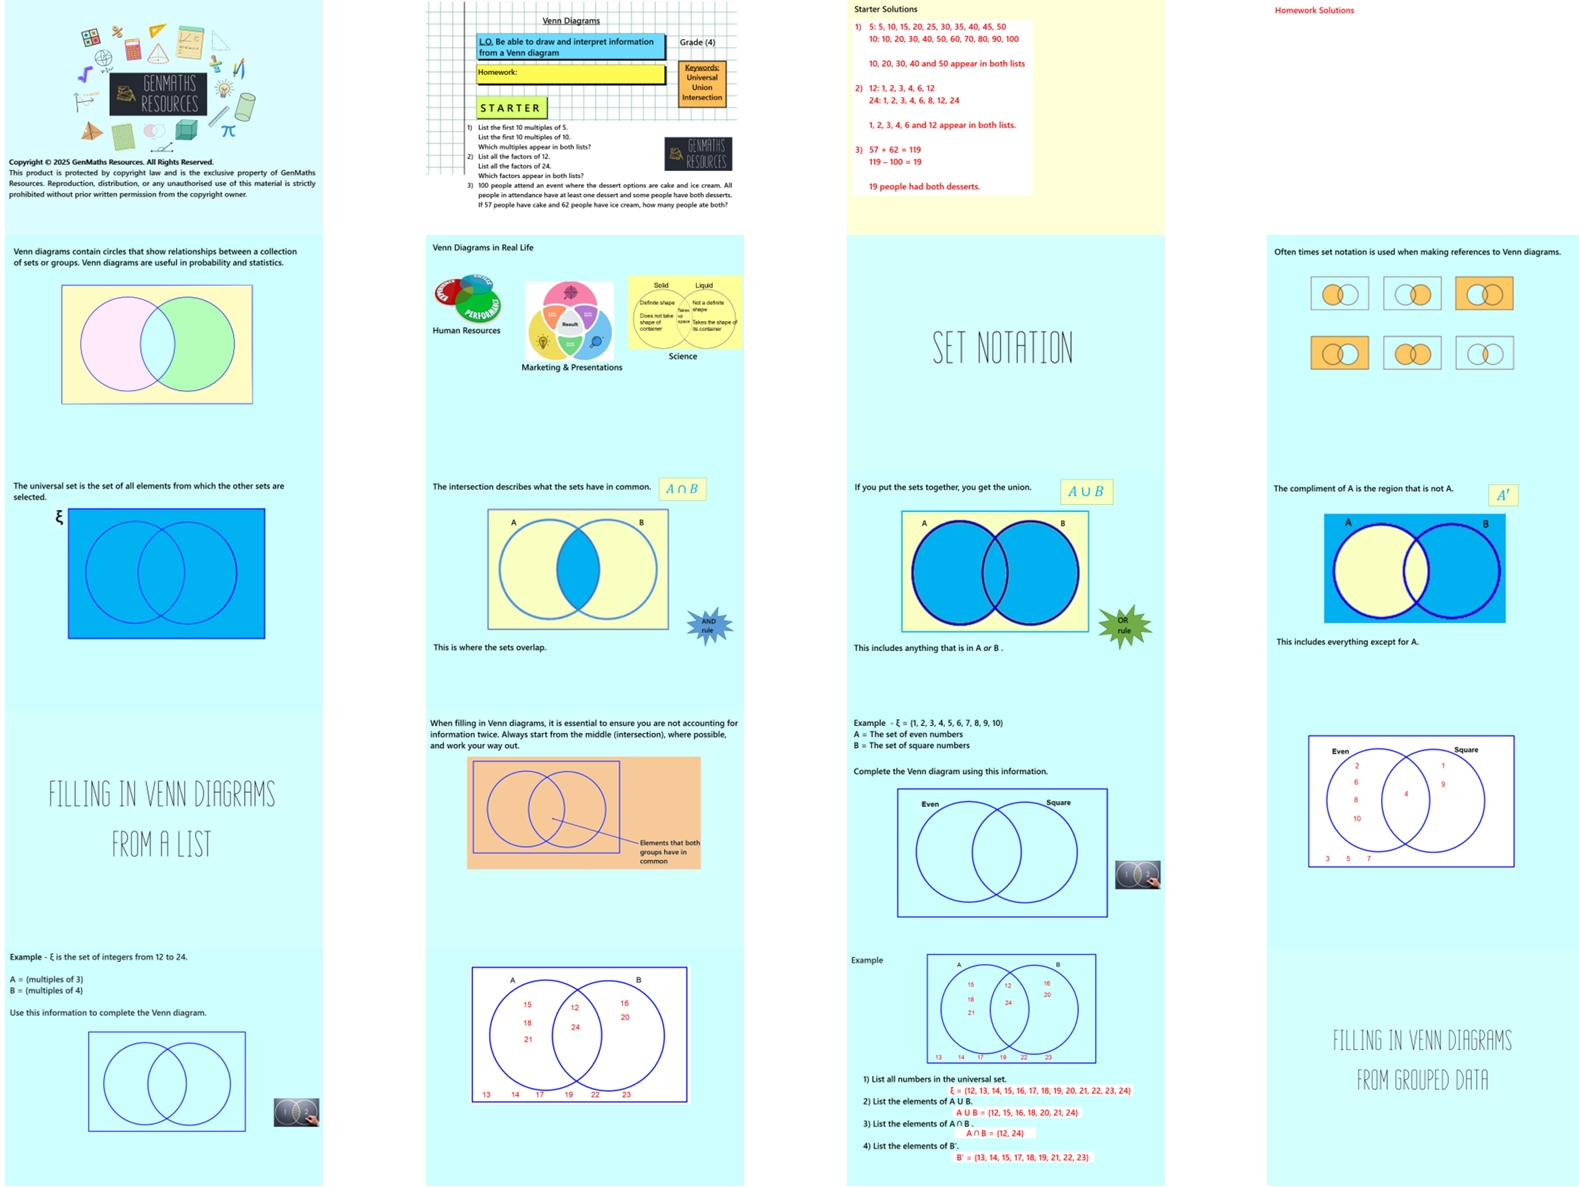
In this 37-slide lesson, pupils will learn how to use Venn diagrams to represent and sort data into categories. They will understand set notation including union (∪), intersection (∩), and complements (A'). Questions include both filling in Venn diagrams from lists of numbers, as well as from grouped data.
The lesson includes:
Clear, guided examples
Discussion opportunities from Think, Pair, Share
Mini whiteboard section to check understanding and clarify misconceptions
Two structured tasks to practise key skills
Challenge activity to extend and deepen learning
Perfect for engaging learners while reinforcing essential data and statistics concepts.