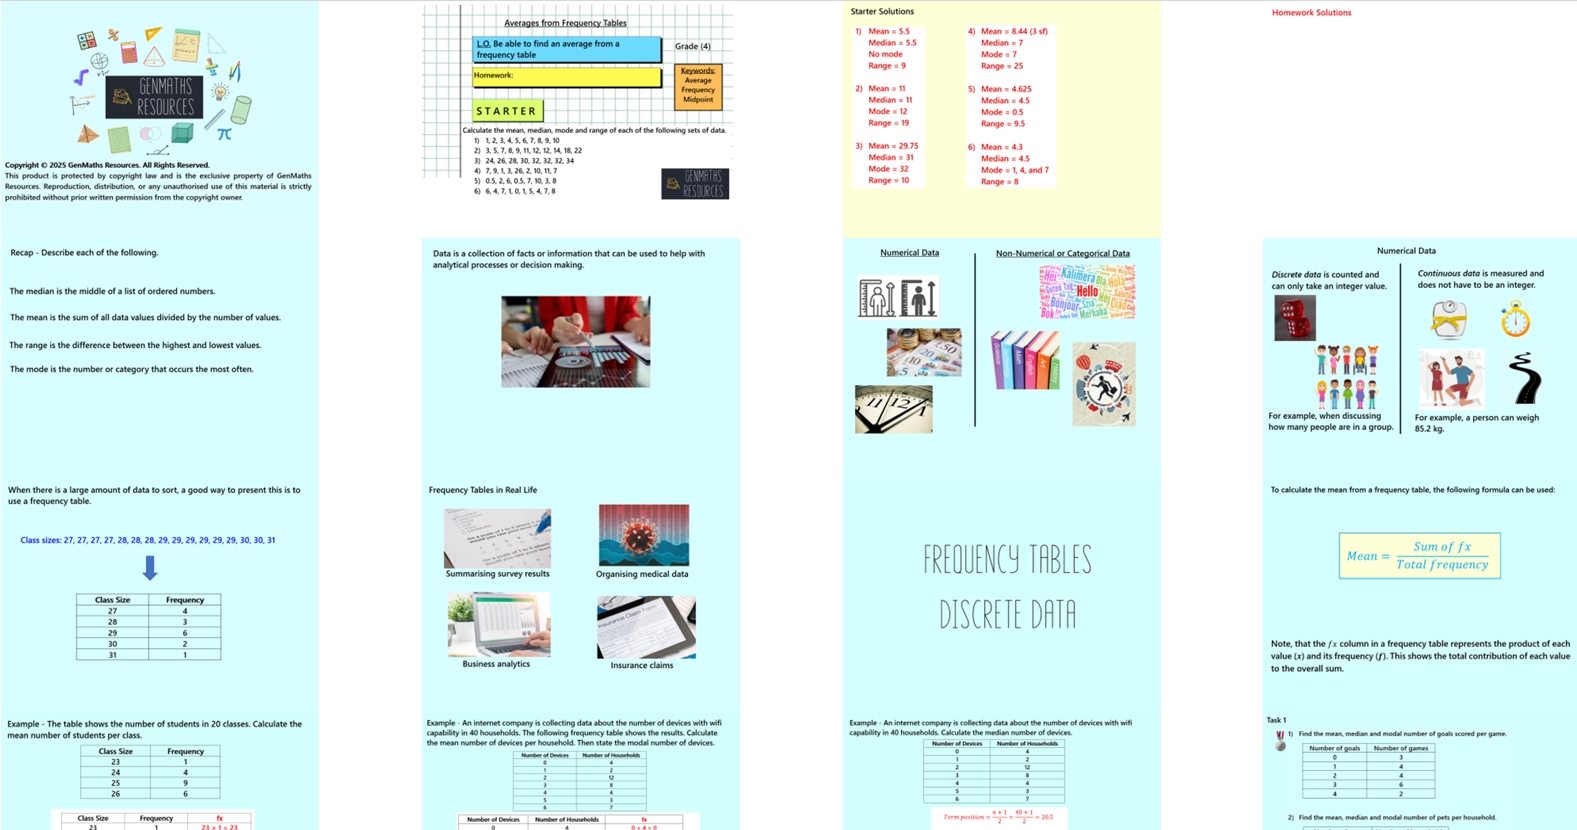
4.2 Averages from a Frequency Table GCSE PowerPoint Lesson
£2.00
In this 26-slide lesson, students will learn how to calculate the mean, median, and mode from frequency tables for both discrete and grouped (continuous) data. They will begin with discrete data, using the column to calculate the mean and identify the median and mode directly from the table. The lesson then progresses to grouped data, where students will calculate an estimated mean using class midpoints and identify the modal class interval and the median class. Students will practise interpreting and analysing data in context and understand the limitations of grouped data when estimating averages.
The lesson includes:
Clear, guided examples
Discussion opportunities from Think, Pair, Share
Mini whiteboard section to check understanding and clarify misconceptions
Two structured tasks to practise key skills
Challenge activity to extend and deepen learning
Perfect for engaging learners while reinforcing essential data and statistics concepts.