4.6 Sample Space Diagrams GCSE PowerPoint Lesson
£2.00
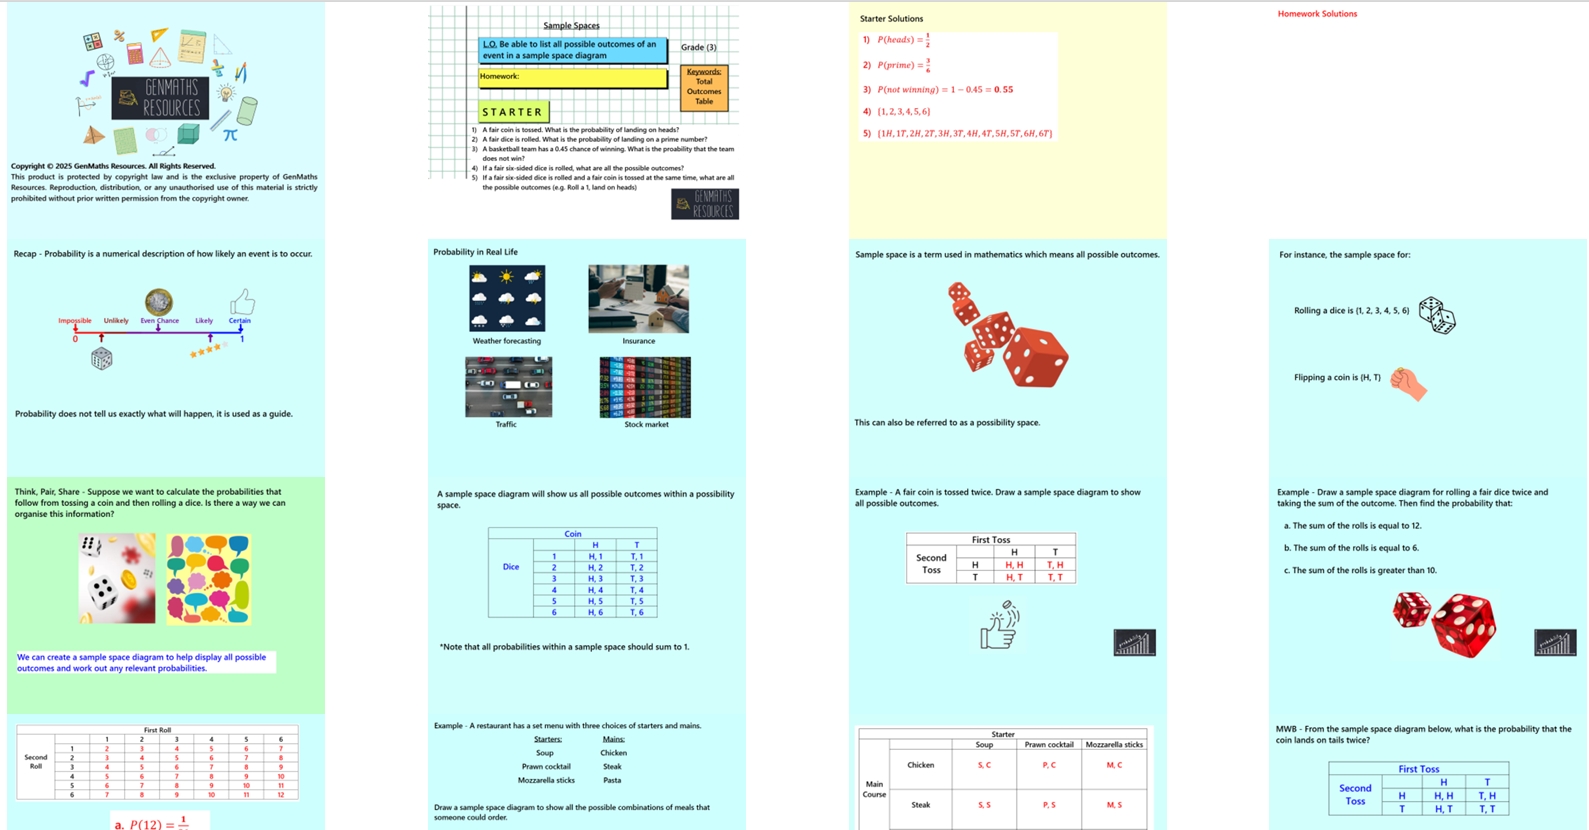
In this 21-slide lesson, students will learn how to construct and use sample space diagrams to list all possible outcomes of combined events. They will explore situations involving two events, such as rolling two dice or flipping two coins, and use the diagram to systematically identify outcomes and calculate probabilities. Students will also use the diagrams to find probabilities of specific events (e.g. "the sum is 7" or "both numbers are even"). The lesson emphasises clear organisation of outcomes and reinforces the importance of a complete sample space in accurate probability calculations.
The lesson includes:
Clear, guided examples
Discussion opportunities from Think, Pair, Share
Mini whiteboard section to check understanding and clarify misconceptions
One structured task to practise key skills
Challenge activity to extend and deepen learning
Perfect for engaging learners while reinforcing essential data and statistics concepts.