4.7 Probability Trees GCSE PowerPoint Lesson
£2.00
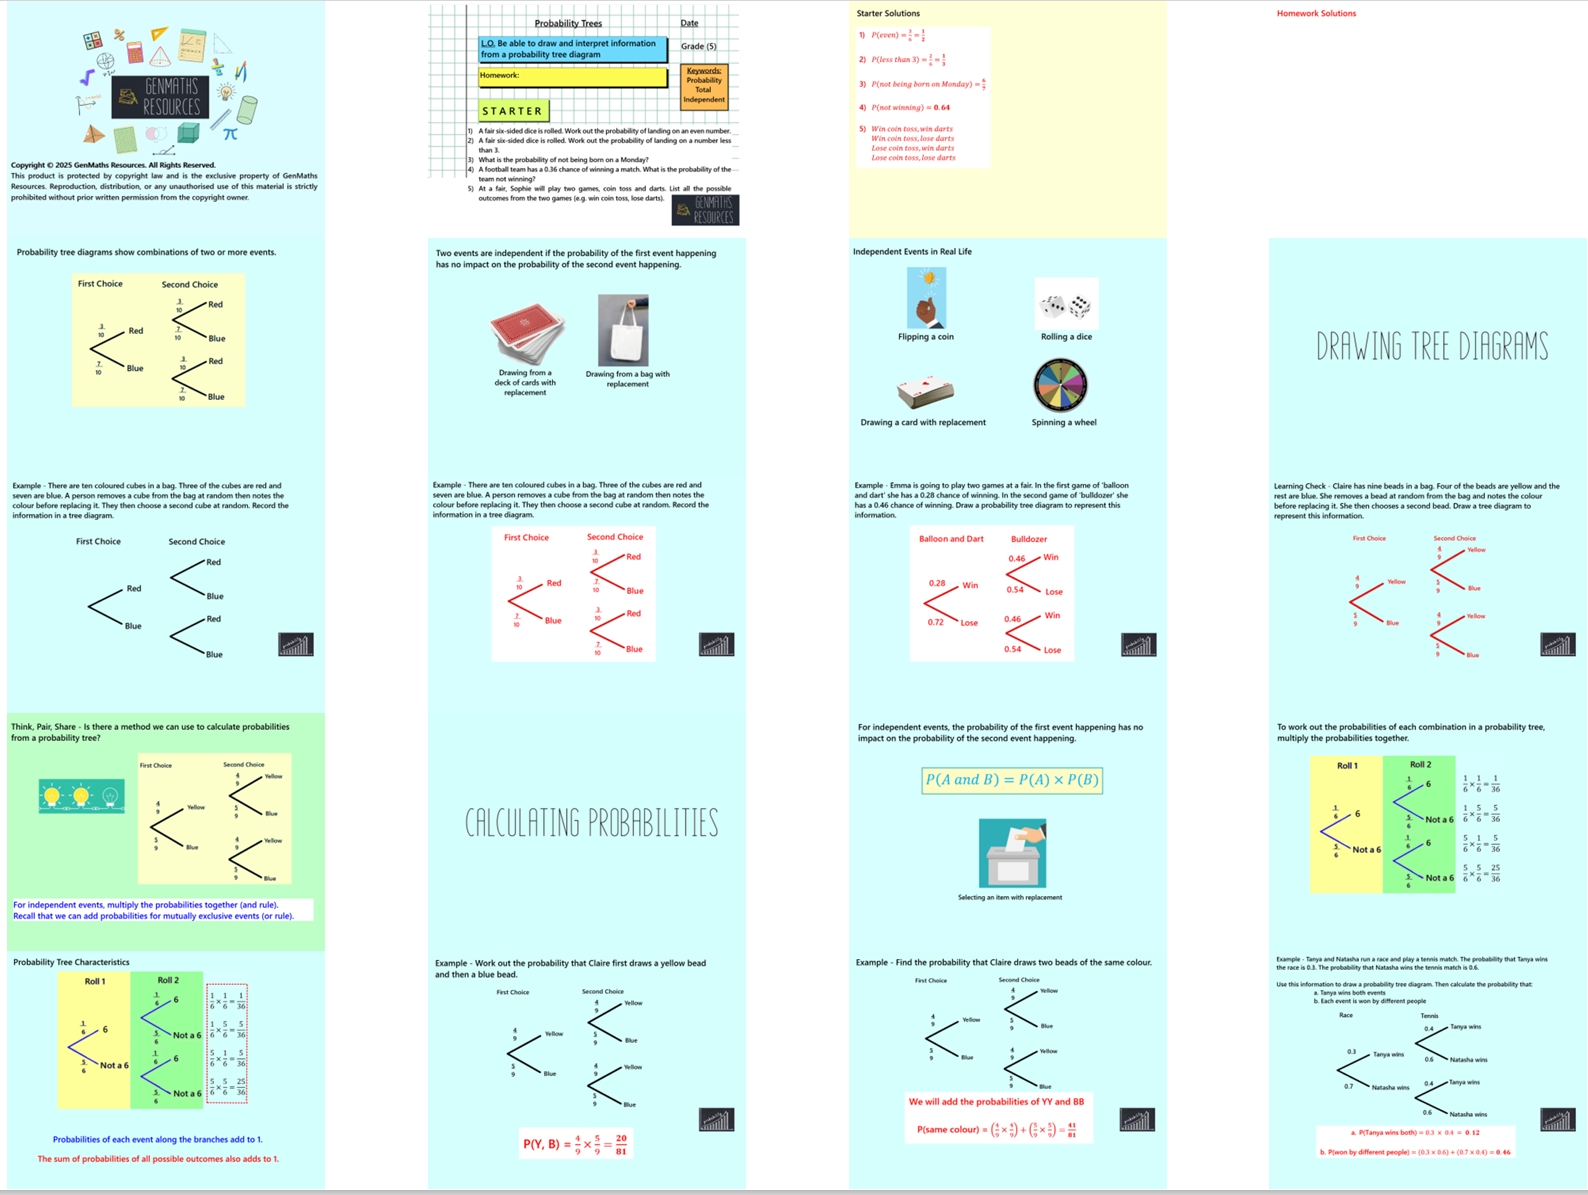
In this 28-slide lesson, students will be introduced to probability tree diagrams as a structured way to represent and calculate probabilities for two-stage events with replacement. They will learn how to complete tree diagrams by filling in probabilities for each branch, and how to calculate the probability of combined outcomes by multiplying along the branches. The focus will be on interpreting the diagram correctly and understanding that with replacement, the probabilities stay the same at each stage. Students will work through real-life examples such as drawing coloured counters from a bag, reinforcing the key skills of multiplying probabilities and adding branches where appropriate.
Note this is a foundation lesson. Conditional probabilities and harder tree diagrams with algebra are available under separate lessons.
The lesson includes:
Clear, guided examples
Discussion opportunities from Think, Pair, Share
Mini whiteboard section to check understanding and clarify misconceptions
Two structured tasks to practise key skills
Challenge activity to extend and deepen learning
Perfect for engaging learners while reinforcing essential data and statistics concepts.