4.8 Tally Charts and Frequency Tables GCSE PowerPoint Lesson
£2.00
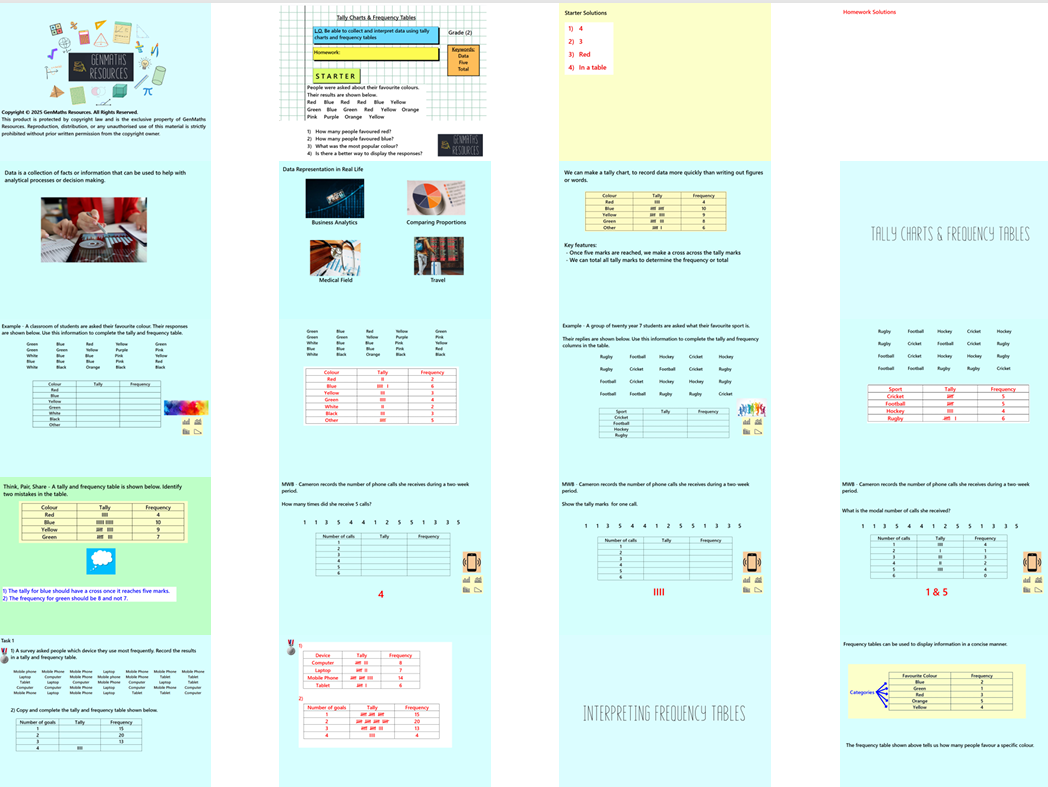
In this 27-slide lesson, pupils will learn how to collect raw data and organise it using tally charts. They will understand how to convert this information into a frequency table, identifying patterns and trends. This topic builds a strong foundation for interpreting and displaying data clearly and accurately.
The lesson includes:
Clear, guided examples
Discussion opportunities from Think, Pair, Share
Mini whiteboard section to check understanding and clarify misconceptions
Two structured tasks to practise key skills
Challenge activity to extend and deepen learning
Perfect for engaging learners while reinforcing essential data and statistics concepts.