4.9 Pictograms GCSE PowerPoint Lesson
£2.00
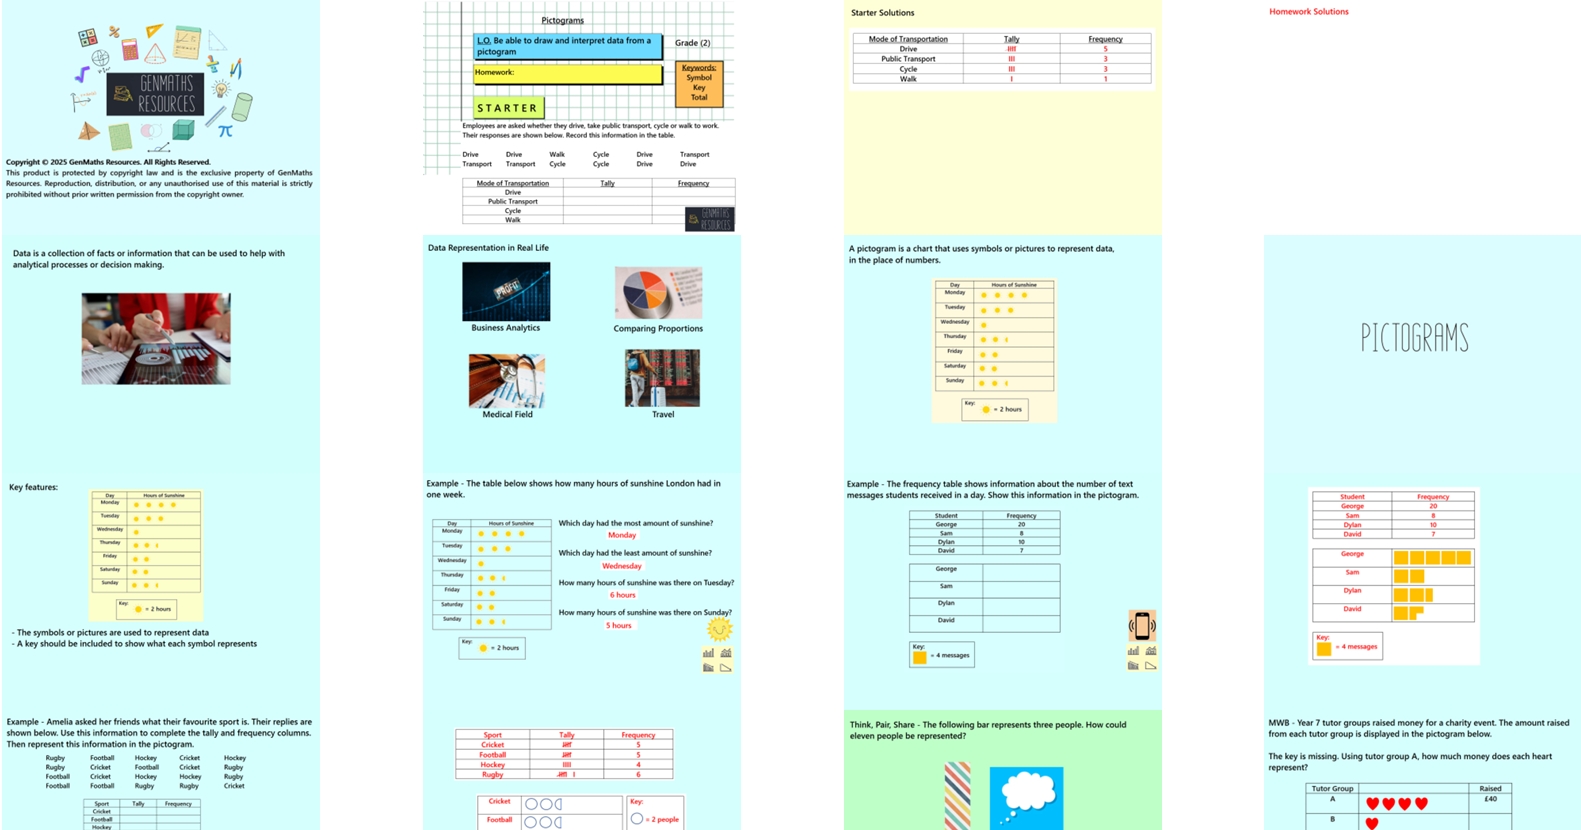
In this 21-slide lesson, pupils will explore how to represent data visually using pictograms, where each symbol represents a specific quantity. They will practise drawing pictograms with different keys and learn how to interpret them effectively. Emphasis will be placed on accuracy and choosing appropriate scales.
The lesson includes:
Clear, guided examples
Discussion opportunities from Think, Pair, Share
Mini whiteboard section to check understanding and clarify misconceptions
One structured task to practise key skills
Challenge activity to extend and deepen learning
Perfect for engaging learners while reinforcing essential data and statistics concepts.